
Unused DB Columns, via logs

a search for ‘unused columns’ brings up this image from Flickr user @denisbin.
Detecting DB Column Usage
I have always been interested in ways to automate & cleanup old unused code. Removing the clutter helps focus in on the things that matter and make clear patterns emerge.
This post continuing on some database cleanup work. The first post of the series is, cleanup unused tables in your database
After taking on full tales, I wanted a way to find unused fields. I came up with two easy ways to try to automate detecting this in a Rails app.
- Previously covered: Query the DB’s paper_trail history
- In this post: We will cover query logging and searching field usage via a log aggregator.
DB Field Usage Output
The output depends on your log search tool. We currently use Sumologic for our log aggregation so all the examples will focus on Sumologic. That being said it would be simple do to this in Splunk and other log aggregation tools.
Aggregated Search Log
If you are running a system that is on more than a single server you should setup aggregated log search. Distributed Logging is basically a requirement for micro-services, and honestly the moment your logs aren’t on a single server.
In Rails to extract column usage out of your logs you need to enable ActiveRecord logging on the application you are targeting. In general this isn’t enabled on production, but you can enable it for a period of time to query later. There can be a slight perf hit for logging query details, but more likely it just increases you log volume, as the perf isn’t very noticeable.
Ways to enable logging:
# enable debug on production add to environments/production.rb
config.log_level = :debug

# debug just for ActiveRecord
ActiveRecord::Base.logger.level = :debug
ActiveRecord Log Format
The specifics of your log header, ender, single line logging, etc… The specifics shouldn’t matter. If you turn on default ActiveRecord logs you should have something like below. If that is making it to your log querying tool you should be good to go.
TS=2017-06-20T14:46:34.881881 PID=00063 USER=000000 LEVEL=I | [1m[35mSQL (1.6ms)[0m [1m[32mINSERT INTO "tracks" ("latitude", "longitude", "accuracy", "action", "action_id", "timestamp", "battery_percentage", "used_memory", "max_memory", "created_at", "updated_at", "gps_enabled") VALUES ($1, $2, $3, $4, $5, $6, $7, ...
Verify you are seeing that in your log collector and then it is as simple as crafting a good query.
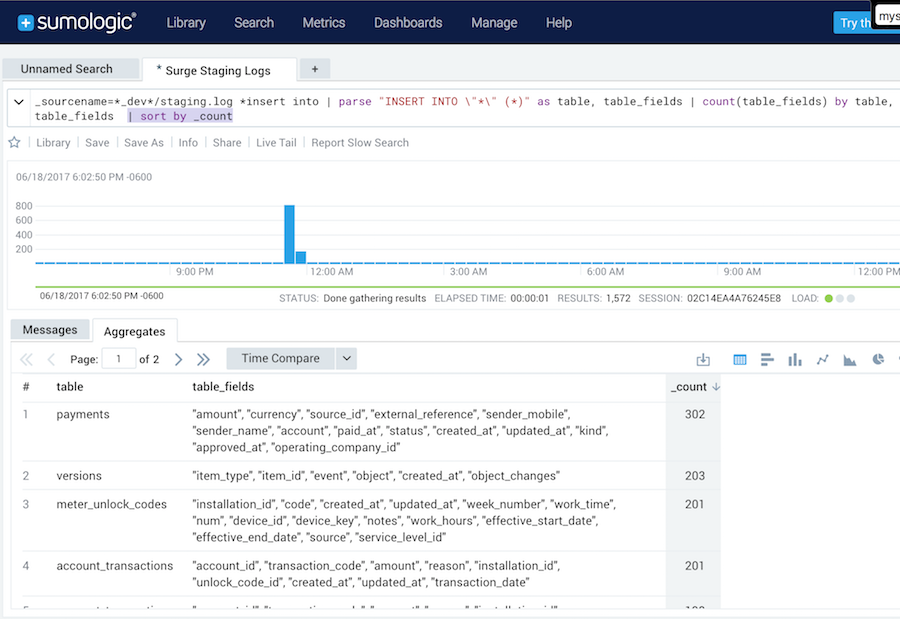
DB Field Log Search
This will be a bit different for any tool, but basically you will be looking to extract the table and all the fields into your tools parsed fields. At that point you can run a query over whatever time period you want to see the count or last timestamp of a given table / field usage.
Find all table / fields updated along with the number of updates in the last search period.
_sourcename=*app.log *insert into |
 parse "INSERT INTO \"*\" (*)" as table, table_fields |
 count(table_fields) by table, table_fields" |
 sort by _count
Find all field usage where the field matches the world ability… Just a simple example of narrowing in on fields you think are likely dead.
_sourcename=*app.log *insert into |
 parse "INSERT INTO \"*\" (*)" as table, table_fields |
 count(table_fields) by table, table_fields |
 sort by _count |
 where table_fields matches "*ability*"
Find all fields with 0 results
This is an exercise for the reader. As it is simple to do human queries on fields you already suspect. If you want to detect anything unused without a good human guess you will need to automate your querying. Basically you will need to implement API access to your log query tool, then iterate through each table and field querying for the last usage, over whatever time period you care about I didn’t do this exercise as using papertrail to detect unused DB columns worked well enough for me.